- General
-
 Bugs
Bugs

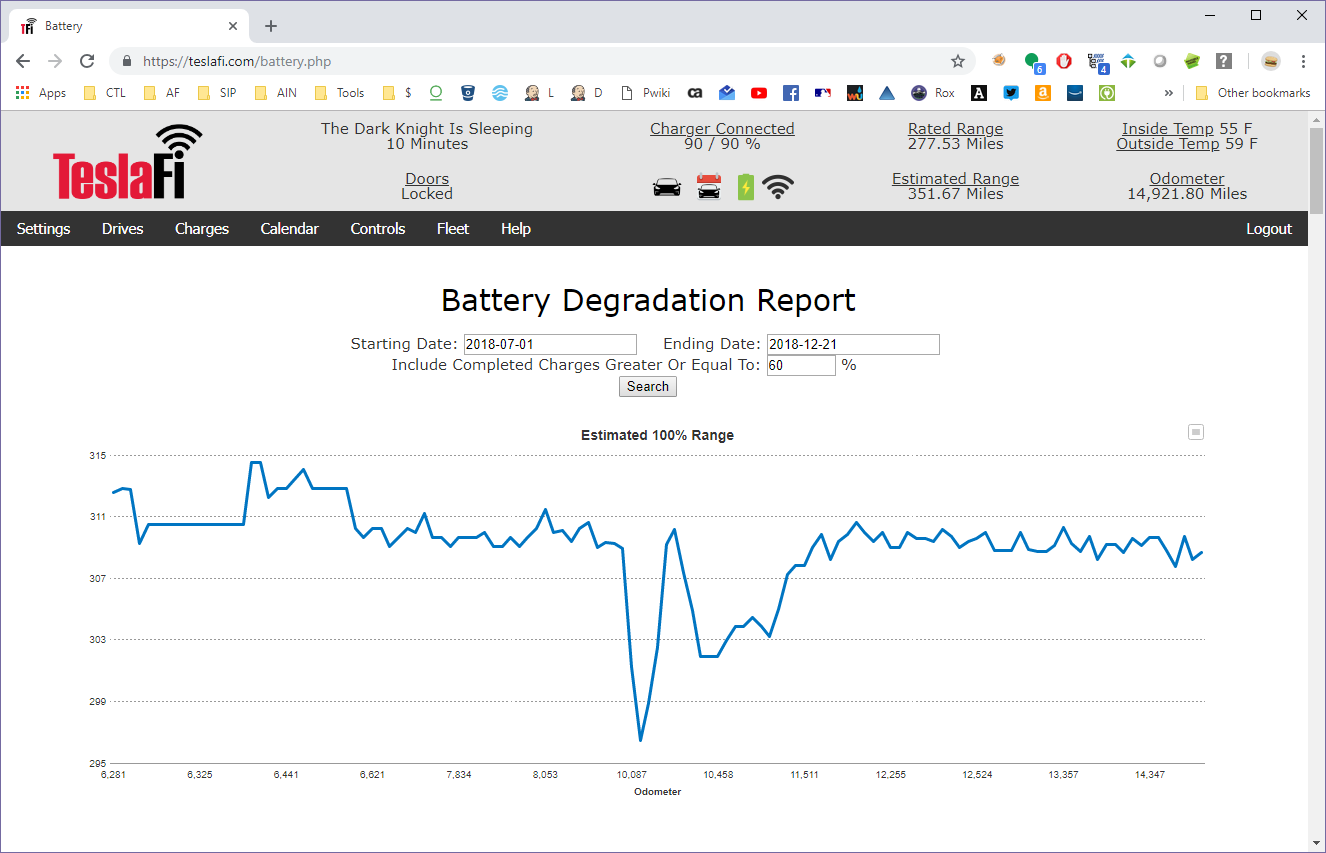
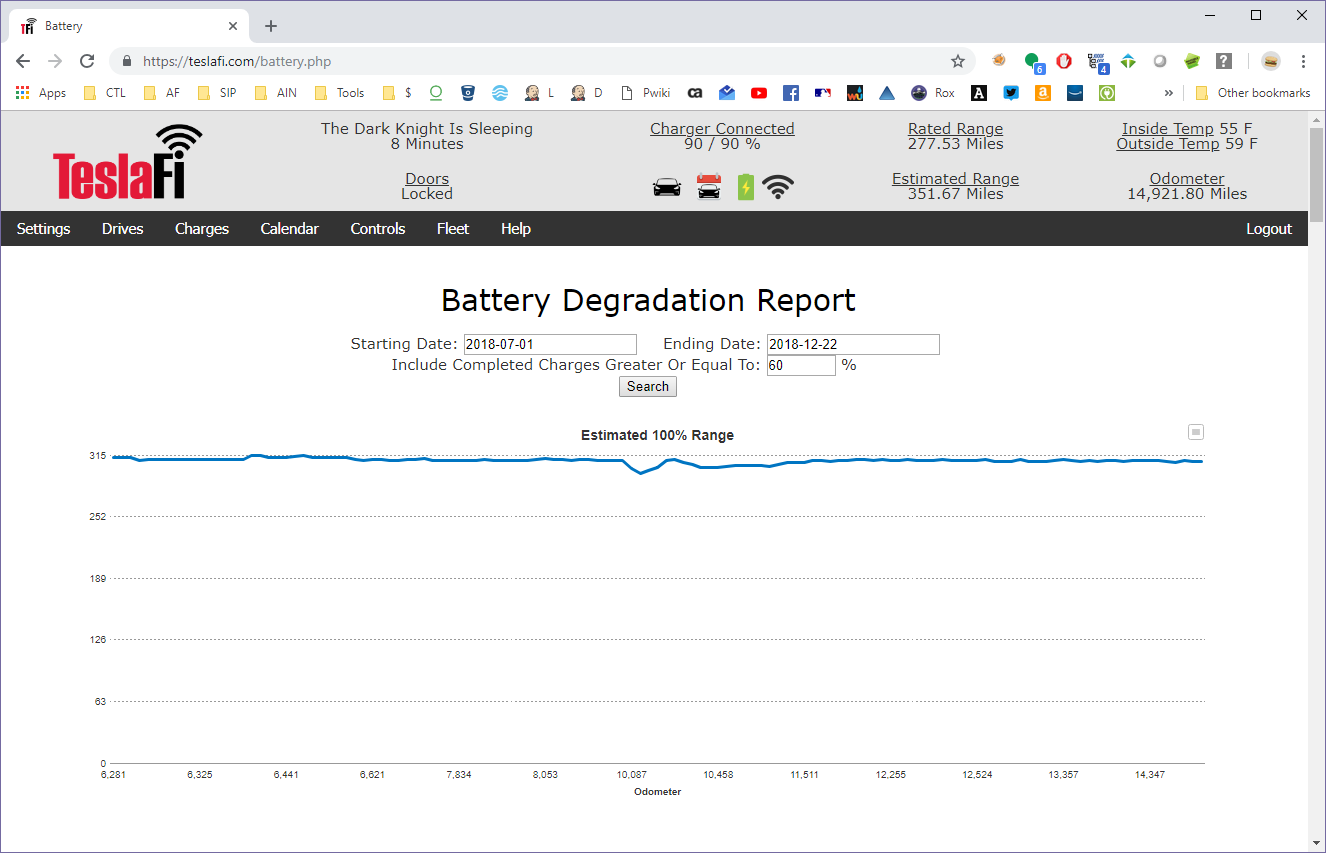
Battery degradation report scale changes depending on date range.
Just pulled a battery degradation report. The starting and ending dates seem to affect the scale somehow, although the rule is not clear. For some date ranges, the scale is good with the highest and lowest charges and the top and bottom of the Y axis, respectively. However, for other date ranges, the scale changes to 0 to 315 and it's suddenly not a very useful report anymore...
Looks good:
And not-so-good:
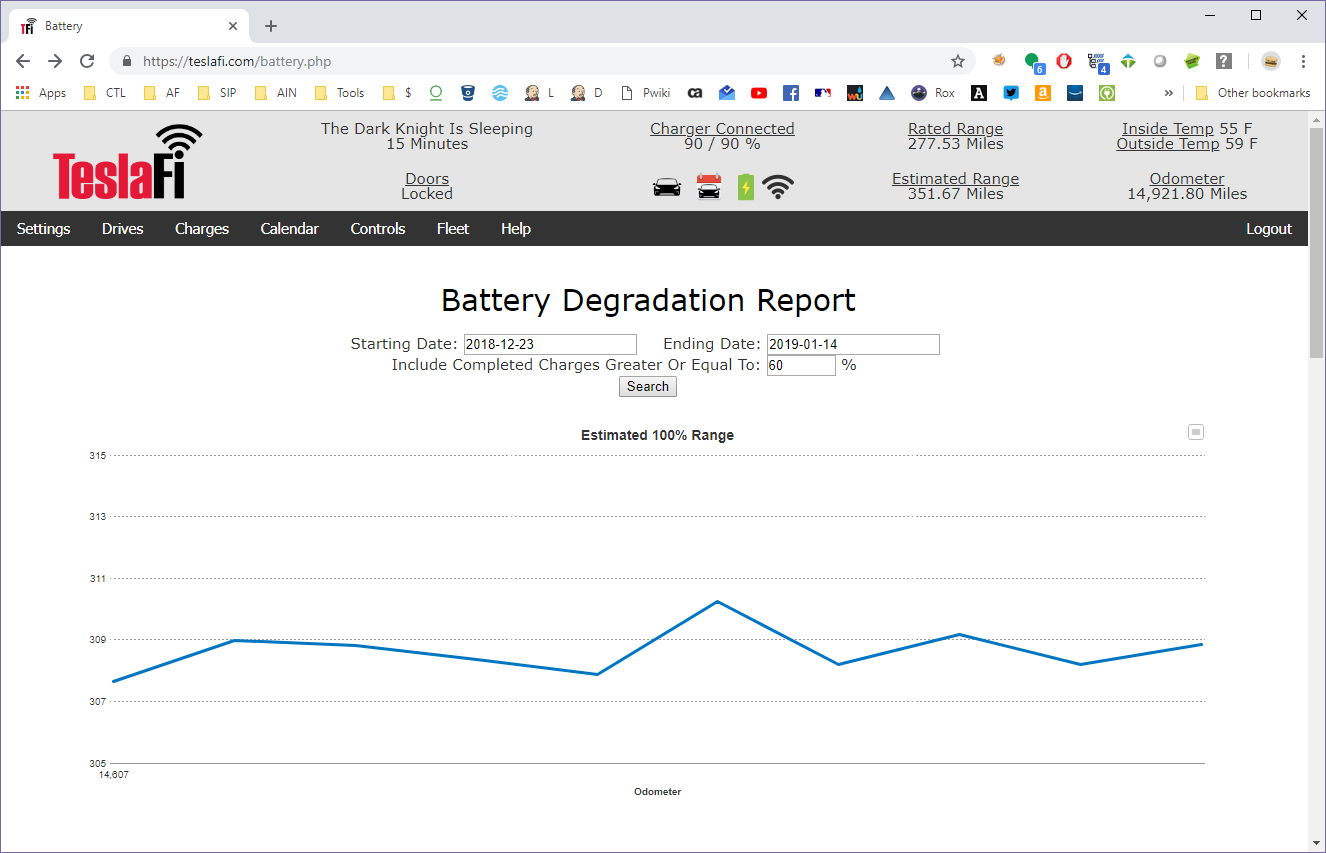
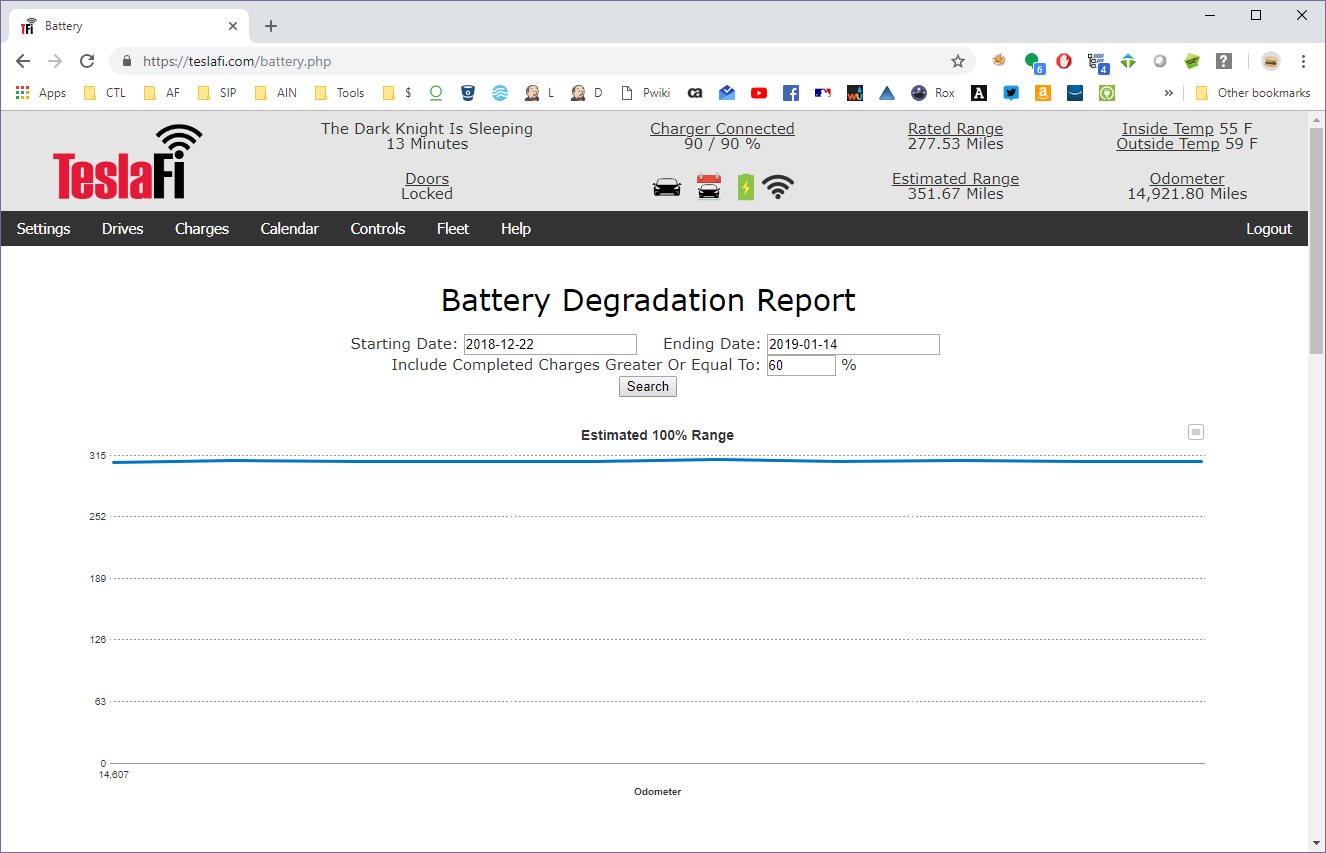
At this point, I thought it might be the number of days causing the problem. But when I changed the ending date to the current date, I found that I had to get the starting date MUCH CLOSER to the current date in order to get a good graph. See below:
Also, as a minor nit, it would be nice if the default ending date when opening the page would be the current date instead of the last-specified date.
Customer support service by UserEcho

I guess the question would be whether you will fix this? The Y axis range changes to something that is almost useless under certain conditions. By having the Y-axis start at 0 miles, the 2nd and 4th charts above don't provide useful information because the line hardly moves at all at that scale. Can you change the scale to be more useful? Our batteries are never going to get to 0 miles of range.
This is very interesting. But I don’t understand your question (or if you have one...?)